What’s Wrong with the BLS Inflation Data?

January 2024's inflation release from the Bureau of Labor Statistics (BLS) on Monday, 12 February 2024, was a big surprise for markets. Instead of the expected drop below 2.9%, inflation only came down to 3.1% for January.
This small decline was out of line with the typically seasonal trend, which tends to see a spending slump following December’s exuberant consumption. It was also out of line with Truflation’s data, which showed downward movement in several categories and led us to predict a drop to 2.5% for January. The markets were also surprised by this news (the S&P 500 is down 1.4% as of this writing).
READ Everything You Need to Know About Truflation’s Index Methodology
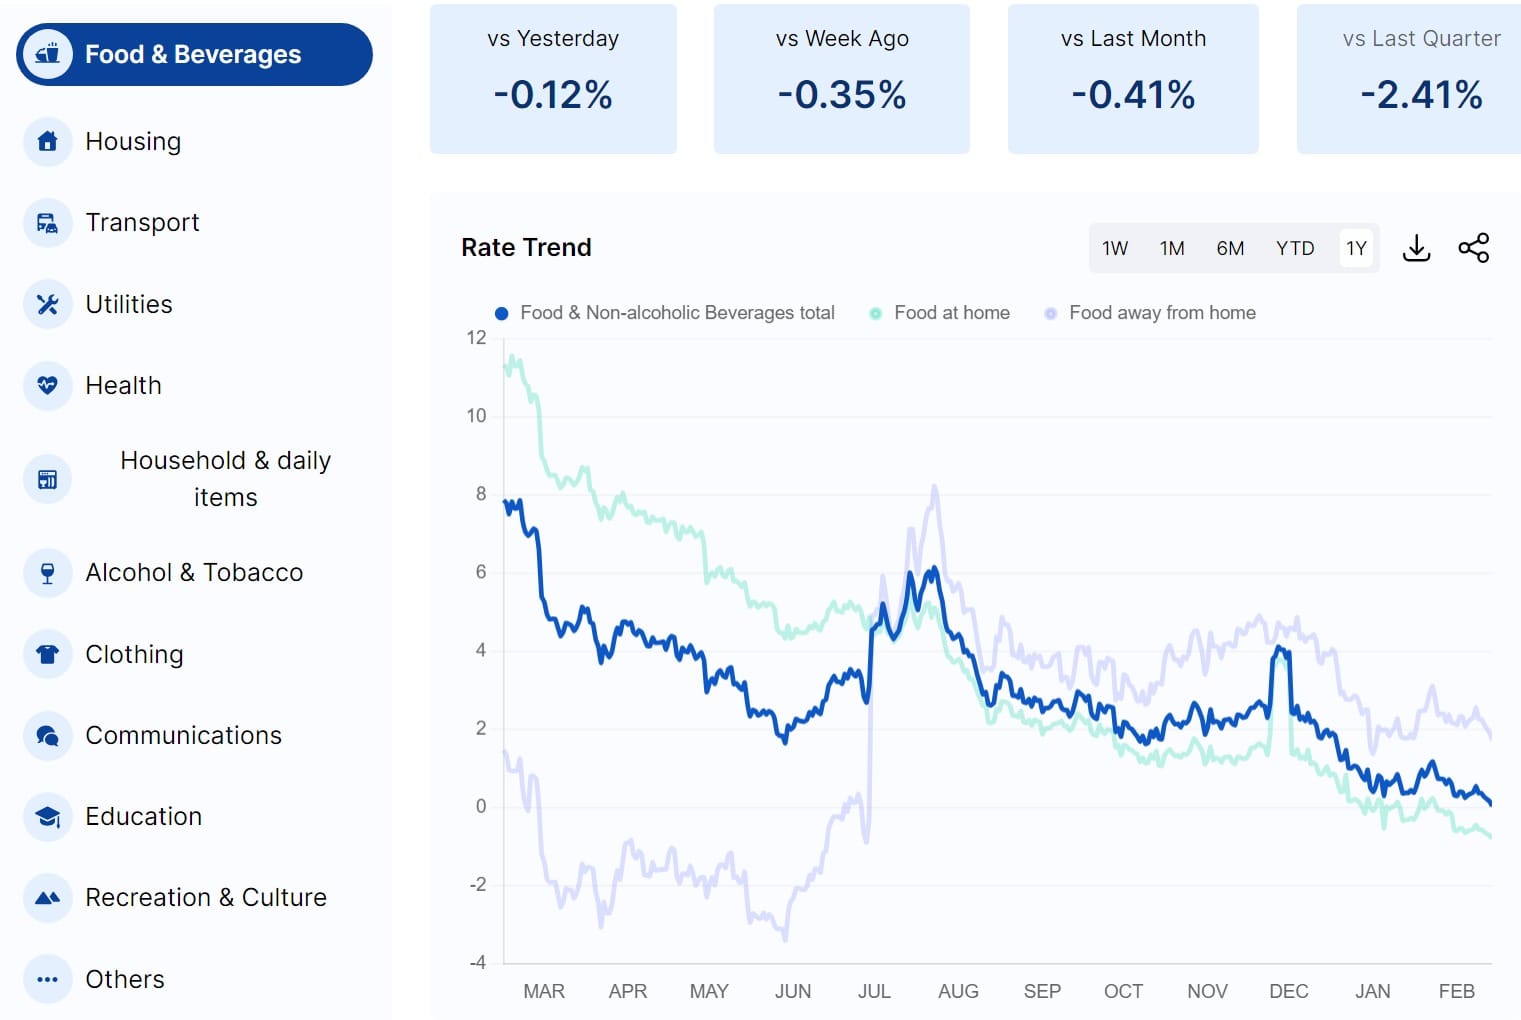
Having compared the BLS figures with Truflation’s real-time, independent US CPI index, we see a number of discrepancies. The biggest among these is the food category, which saw prices increase by 0.6% month-over-month (MoM) in January, according to the BLS. We don’t see how this could be an accurate representation of the situation on the ground. The BLS data for transport and shelter also reflects a trend that isn’t consistent with our data, which more than accounts for the discrepancy between our prediction and the BLS release.
BLS vs Truflation: Where are the discrepancies?
Food

When it comes to food, the issue is that the BLS looks at the price of an item and compares it to the price of that same item a month later. It doesn't take into account seasonal promotions, discounts, or even consumer downtrading (despite having a model for this). Truflation, on the other hand, bases its index on millions of price points to track the impact of various seasonal trends on prices, and our data shows that the food category, in fact, saw prices decrease by 0.58% MoM in January.
Lodgings Away From Home
Equally surprising is the fact that the BLS has seen a significant increase in the price of lodgings away from home of 1.8% MoM. Our data, on the other hand, shows a decline. This is somewhat surprising, to say the least, given the significant drop in airport passenger numbers being down 11% in January compared to December (according to the Transportation Security Administration) as holiday travel came to a standstill.
Owner's Equivalent Rent (OER)
On housing, there is a big discrepancy around the Owner's Equivalent Rent (OER) component, which is based on the rental cost of a primary residence in the BLS data. The BLS has been keeping the prices of OER really high, whereas we have seen this holding steady. This has many flaws, but most importantly, it puts homeowners and renters into the same boat, failing to accurately reflect what people are paying in mortgages.
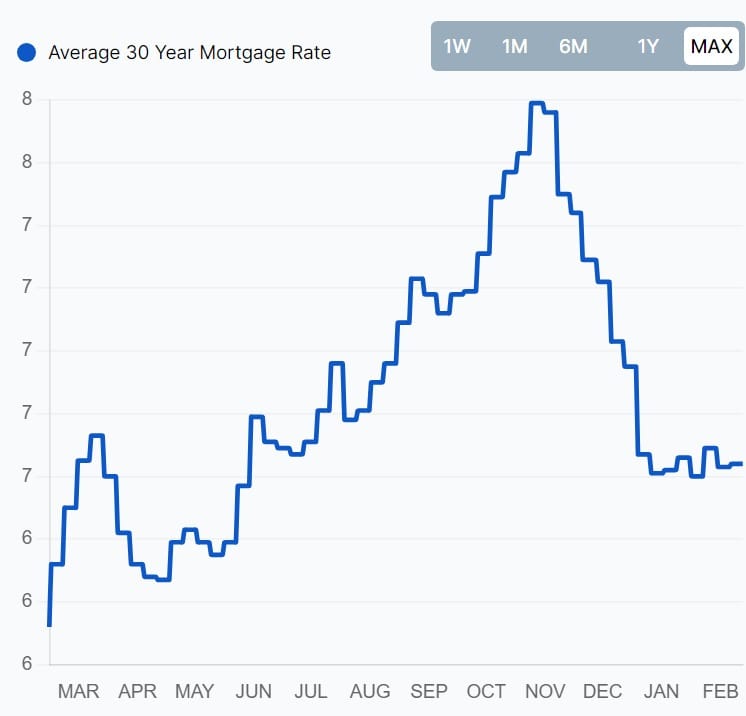
30-Year Fixed Mortgage

The bulk of homeowners locked in their 30-year fixed mortgage rates before the pandemic, which means their outgoings are significantly lower than for those renting. In addition, the amount remaining on their mortgages will also affect their repayments – for example, those with just 20% left on their mortgage will pay less every month than those with 80% remaining.
READ How to Use Truflation’s Personal Inflation Calculator to Get a Raise
Rental Prices
Even when it comes to rental prices, the BLS reports a much higher amount than our data suggests, since their sample is based on a limited number of interviews – just 6,000 to reflect the entire country. Truflation’s number, on the other hand, is based on millions of rental renewals and new rental agreements every month across the entire country. We have been seeing some supply constraints, which are putting upward pressure on prices, but in general, we have seen rental costs coming down as new construction of residential properties is completed.
50% of the US CPI Index
Between them, these categories make up nearly 50% of the US CPI index, so these discrepancies have a significant effect on the overall inflation number, and explain the reason why our January BLS projection of 2.5% came in far below the reported number of 3.1%. In particular, the discrepancy in food and housing will have a significant impact on the overall figure.
What does this mean for the Fed?
However, policymakers still base their monetary policy decisions on these outdated numbers. As such, January's underwhelming drop in inflation cements the Federal Reserve’s current hawkish stance on interest rates even further.
No Need for a Cut Right Now
Regardless of where the real inflation number is – and we believe it’s much lower than that reported by the BLS – the reality is that there is probably no need for an interest rate cut right now, because inflationary pressures remain and the US economy does not require stimulating. Interest rate cuts are a tool the Fed uses to boost economic growth, but the markets are booming and GDP growth for Q4 came in well above expectations. The labor market remains tight and wage growth is accelerating.
Watch for the PCE
So, for the time being, economists and policymakers will continue watching the data for signs of weakness, but the Fed will not pull the trigger at its next meeting. There are a number of data releases we will be watching over the coming weeks ahead of the next Federal Open Market Committee (FOMC) meeting. The PCE inflation number is coming out on February 29 and the Fed will be watching this figure closely. We may see it come down below 2% temporarily but, like the CPI number, we expect this to rebound in February and March, driven by labor market strength.
Taking their Time
On top of this, the Fed will be keeping an eye on the household savings rate, the employment market, and the upcoming Personal Income and Outlays report at the end of February. If we see increases in all of these data sets, policymakers will be reassured that they can take their time with interest rate cuts.
Consumer Sentiment Index
They will also be looking for signs of declining consumer confidence, especially ahead of the election. However, so far, this also remains well above expectations, with Truflation’s Consumer Sentiment Index hitting its highest level since we initiated coverage 18 months ago.
The economic softening is still likely to come eventually but for now, it appears we’re stuck in limbo when it comes to the monetary policy outlook. As for the crypto market, it will likely need to find other catalysts for growth in the next few months.
Want to be part of the data revolution? Join our Telegram to always be in the loop!

