Truflation Public Peek: U.S. Monthly Inflation — July 2025

The following is a public peek at our exclusive 12-page in-depth monthly Truflation CPI update, available by subscription, here.
Executive Summary
Despite the second quarter GDP growth, the figures have some worrying trends that suggest that the US economy is heading into a period of noticeably slower growth which is likely thanks to the impact of tariffs on inflation, the tightening of the labor market and as a consequence shrinking consumer spending.
With the price increases occurring as a result of the new tariff policies, it will eat into real incomes, at a time when consumer spending is starting to look a bit shaky. Monthly retail sales and personal spending have started to cool in the last couple of months, despite the increase in prices. It is evident that spending on balance has stagnated for the first six months of the year which rarely happens outside of a recession.
Exhibit 1 – Retail Sales & Personal Spending Percentage Change on a MoM basis
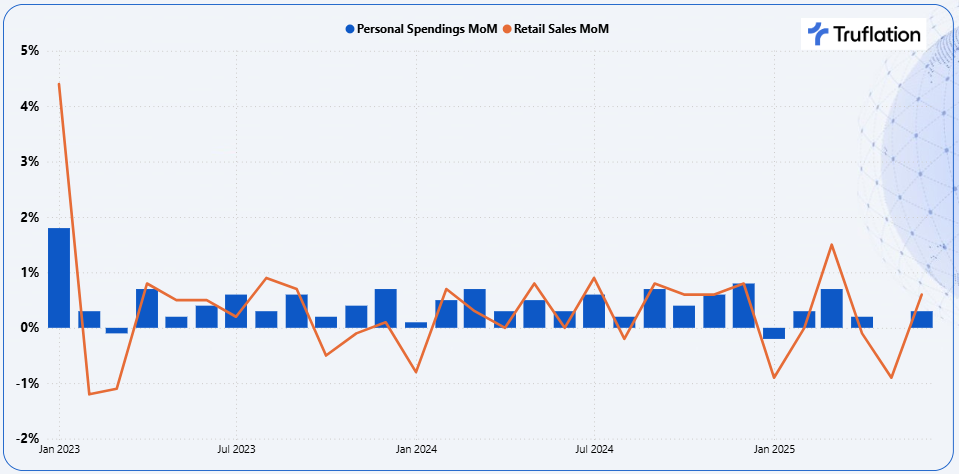
The advance estimate of the second quarter GDP was 3.0% which rebounded significantly (compared to Quarter 1 which declined -0.5%) and is primarily a reflection of the downturn in imports but it is the consumer spending which accounts for two thirds of the US economy which has experienced an acceleration this quarter but still is muted. This growth has been offset by the downturn in investment.
---
[Excerpt ends mid-Page 1]
[Pages 2–7 omitted]
[Excerpt resumes mid-Page 8]
---
Recent inflation trends
The tariffs are now evident in the hard data and with the more broader impact of tariffs likely to be felt with Canada, Mexico and China to be confirmed. The BLS Consumer Price Index Report is expected to show a continued uptick in inflation with our forecast for the end of the summer remaining at 3% on an annualized basis. This view has translated into a consistent uptick forecast with a range from 2.6% to 2.9% Year on Year. Truflation is expecting the increase to come in at 2.8% on an annualized basis with this gradual rise set to continue.
Truflation data highlights the impact of tariffs on the prices of goods as they are the driving force of upwards movement of prices and have seen a continued acceleration, while the more volatile categories of food and energy have continued their de-acceleration as consumers look for less expensive alternatives. Services on the other hand has seen a slowdown in prices with an increased competitiveness in the market but also remain partially stubborn given the continued higher wage growth.
At Truflation we are seeing inflation start to take a steady increase in goods, but it is being offset by the volatile categories and services. We certainly expect the prices of goods to continue to accelerate in the coming months and continue to drive inflation upwards.
Exhibit 9 – Truflation Category Inflation Drivers
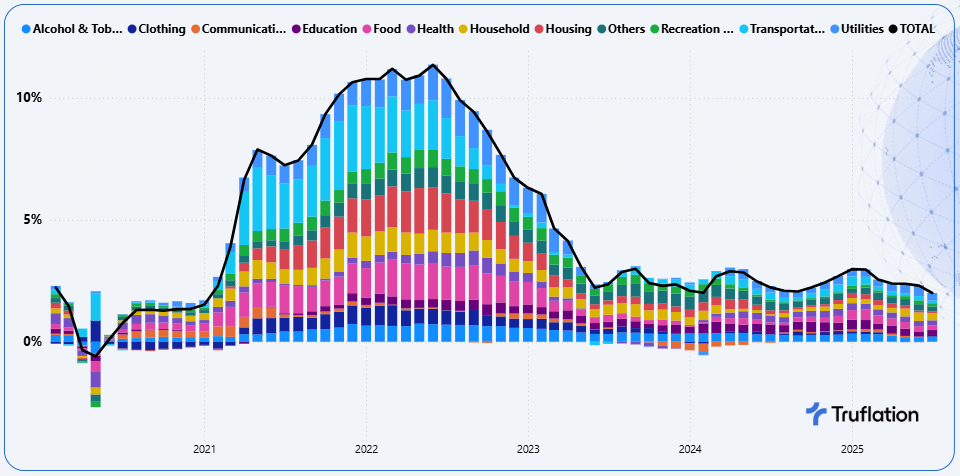
With inflation experiencing a more consistent upward movement, it is clear the risks continue to be to the upside. The most significant upward contributing categories to inflation in July are coming from Education, Utilities, Health and Alcohol & Tobacco. While Food and Housing are the biggest downward contributors.
Sector-Specific Inflation Analysis
---
[Excerpt ends mid-Page 9]
[Pages 10–12 omitted; report ends on Page 12]
---
The above is a public peek summary at our 12-page exclusive monthly Truflation CPI update, available by subscription, here.
Truflation Website | TRUF.Network | X | Linkedin | Discord | Telegram | Github| YouTube